Algorithmic Leaderboards Guide Repetition Patterns in Web-Based Instant Arcade Sports and Racing Games

Platform designers have embedded ranking systems into browser-based arcade titles that track metrics such as lap times, goal completions, and streak multipliers, and these systems now direct how players return to sessions across sports and racing formats. Data from multiple tracking services shows that participants adjust their session lengths and strategy choices when visible position indicators update after each attempt, which creates measurable shifts in repeat engagement rates.
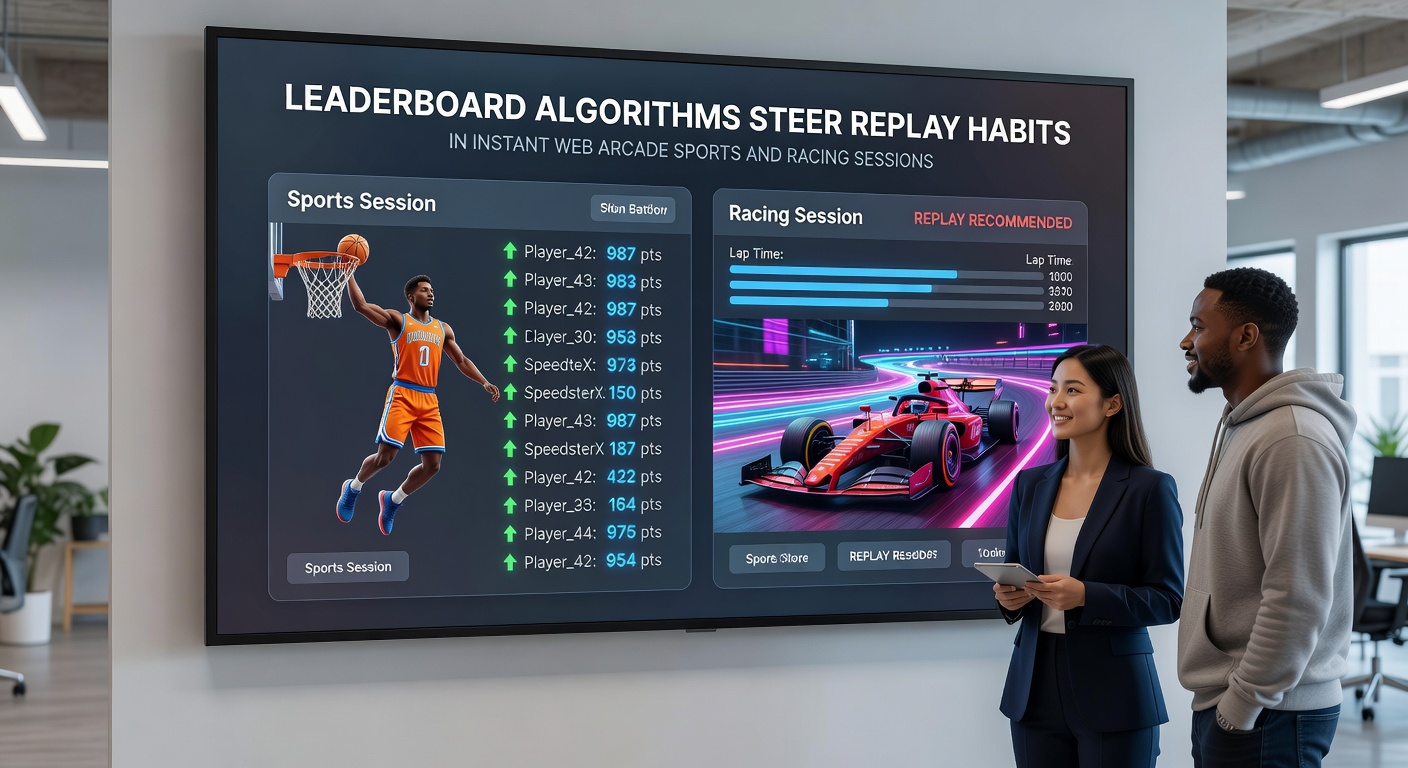
Mechanics Behind Ranking Calculations
Algorithms process inputs including completion speed, accuracy percentages, and opponent interactions within short matches that last between two and five minutes on average. Developers weight these factors differently across game types, so a racing title might emphasize overtaking counts while a sports variant prioritizes defensive actions or scoring efficiency. Observers note that the resulting scores feed into global or regional leaderboards that refresh every few seconds during peak hours, which means players receive immediate feedback on their standing relative to others logged in at the same moment.
Adjustments to these weighting systems occur periodically based on aggregate participation data collected through May 2026, when several platforms reported that fine-tuning the visibility of mid-session rank changes increased the average number of attempts per unique visitor by noticeable margins. Researchers from institutions such as the Entertainment Software Association have documented similar patterns in aggregated industry reports covering casual web titles.
Observed Effects on Session Frequency
Players frequently initiate new rounds immediately after viewing an updated position, and this behavior appears strongest when the algorithm highlights incremental progress toward the next threshold rather than distant top placements. In racing environments the emphasis on split-second improvements encourages repeated tries at the same track layout, whereas sports sessions see more variation as participants test different team configurations or play styles to climb divisions.
Patterns Across Game Categories
Tracking logs indicate that racing formats generate higher replay counts per session than team sports variants because the former deliver clearer, quantifiable gains from minor control refinements. Sports titles, by contrast, incorporate elements like passing accuracy or shot timing that require broader adjustments, which spreads attempts across multiple match types instead of concentrating on one. Both categories show elevated activity during evening windows when leaderboard populations peak, and this concentration correlates with longer overall time spent on the platform.
Regional Data and Platform Comparisons
Figures compiled through early 2026 reveal that North American and European servers record comparable replay ratios, yet Australian platforms display slightly elevated session starts linked to timezone alignment with Asian player bases. The International Game Developers Association has published summaries noting that smaller studios often rely on simpler ranking formulas that update less frequently, which produces steadier but lower-intensity engagement curves compared with larger services running continuous recalculations.
One study released by a Canadian research consortium in March 2026 examined three popular browser racing titles and found that users who viewed their percentile ranking after every match completed an average of 1.8 additional rounds before exiting, whereas those who saw only final scores after a set of matches showed reduced continuation rates. These differences hold across device types, although mobile browsers register modestly higher drop-off when network latency delays leaderboard refreshes.
Technical Adjustments and Player Response
Engineers implement decay functions that gradually lower older scores to keep current leaderboards relevant, and this mechanism prompts participants to return within defined windows to maintain visible progress. When decay rates increase, repeat login frequency rises accordingly, according to internal metrics shared in industry briefings. Sports arcade variants sometimes layer team-based rankings on top of individual scores, which introduces cooperative elements that further influence how often groups coordinate sessions.
Platforms continue to test variations such as streak bonuses or daily position challenges that reset at midnight in each user's local time zone. These additions create distinct peaks in activity that align with the reset schedule rather than uniform daily distribution, and data indicates the pattern persists through seasonal changes in player volume.
Conclusion
Leaderboard algorithms embedded in instant web arcade sports and racing sessions shape return behavior through immediate feedback loops, weighted metrics, and periodic resets. Evidence collected up to May 2026 demonstrates consistent correlations between ranking visibility and session repetition across multiple regions and game subtypes. Continued monitoring by industry groups and academic researchers provides ongoing insight into how these systems evolve alongside player habits on browser platforms.